환경
모니터링 서버
CentOS 7.6.1810
OpenJDK 1.8
운영 서버
Tomcat 8.5.58
1. Prometheus에서 다운받을 링크를 복사한다.
https://prometheus.io/download/
Download | Prometheus
An open-source monitoring system with a dimensional data model, flexible query language, efficient time series database and modern alerting approach.
prometheus.io

2. 모니터링할 서버에 접속하여 prometheus 폴더를 생성하고 복사해둔 링크를 입력하여 다운받는다.

3. 다운받은 파일을 압축 해제한다.

4. 다운받은 압축 파일을 삭제한다.

5. prometheus.yml 파일에 job 내용을 추가한다.
- 여러개일 경우 컴마로 구분하여 추가 할 수 있다.

6. prometheus를 실행한다.
- ./prometheus --config.file=prometheus.yml
- 명령어 뒤에 & 를 추가하면 백그라운드 실행

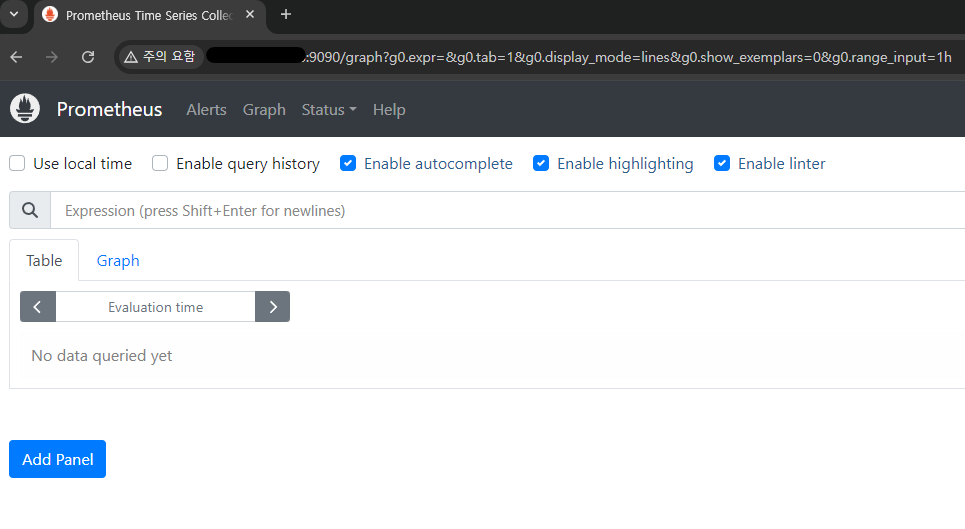
7. IP:9090으로 접속하여 확인
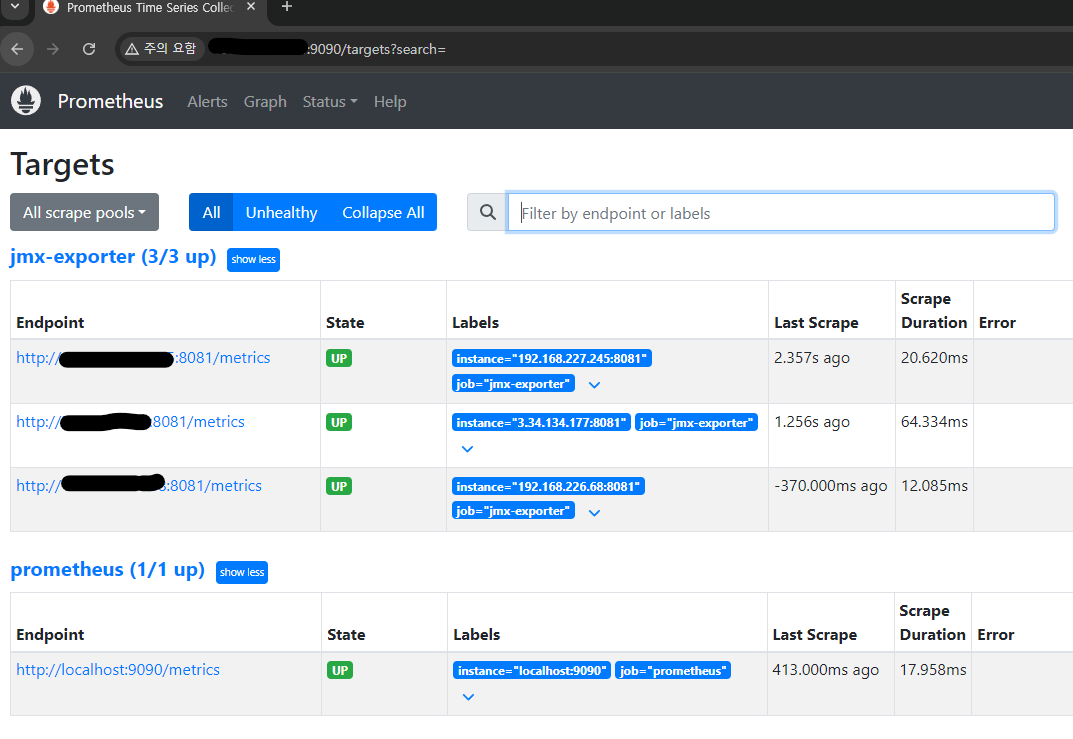
8. 연동 확인을 위해 Status > Targets 로 이동하여 state 를 확인한다.
모니터링 서버에 prometheus 설치까지 진행되었다.
다음 포스팅에서 grafana 설치 방법을 이어 진행하도록 한다.
참고
https://canaryrelease.tistory.com/17
[DevOps]로컬환경에서 JMX exporter + Prometheus + Grafana로 자바 모니터링 (3)Prometheus 설치
이번 포스팅에서는 지난 포스팅들에 이어 Prometheus + Grafana로 자바 모니터링 시스템을 구축하기 위해 프로메테우스를 설치해보도록 하겠다. [지난 포스팅] https://canaryrelease.tistory.com/15 - [DevOps] 로
canaryrelease.tistory.com
https://hippogrammer.tistory.com/256
Prometheus를 systemd로 관리
RedHat 계열의 CentOS 서버에서 Prometheus를 설치하고 systemd로 관리 Security Group, Firewall 등으로 9090번 포트에 대한 방화벽 해제가 필요 1. Prometheus 설치 설치하고 싶은 Prometheus 버전의 경로를 잘 확인하
hippogrammer.tistory.com
'개발 > etc' 카테고리의 다른 글
| [Test] Jmeter를 이용해서 HTTP Stress Test (0) | 2024.08.27 |
|---|---|
| JMX exporter + Prometheus + Grafana 로 자바 모니터링 (3) (0) | 2024.08.26 |
| JMX exporter + Prometheus + Grafana 로 자바 모니터링 (1) (0) | 2024.08.26 |
| [Intellij] maven 의존성 트리 조회 (0) | 2024.07.24 |
| [Redis] 윈도우 환경에 레디스 설치 (0) | 2024.07.17 |


